How to Backtest Funding Rate Strategies with Historical Data
Step-by-step guide to backtesting funding rate arbitrage strategies. Learn how to use historical data to validate your strategies, estimate realistic returns, and avoid curve-fitting traps.
Why Backtest Before You Trade?
Would you invest $10,000 in a strategy without testing it first? Backtesting lets you simulate how a funding arbitrage strategy would have performed using real historical data — before risking real capital.
Try backtesting on FundingView →
What You'll Learn
- How to pick a pair and exchanges for backtesting
- How to interpret backtest results
- What pitfalls to avoid (overfitting, survivorship bias)
- How to go from backtest to live trading
Step 1: Choose Your Pair
Start by finding a pair with a consistent funding rate spread between two exchanges.
Using the Strategy Page
Go to the Strategy page and sort by APR. Look for pairs where:
- The APR has been stable over 30+ days (not just a one-day spike)
- At least 2 exchanges consistently have different rates
- The pair has sufficient liquidity on both exchanges
Popular choices for beginners: BTC, ETH, SOL — they have the deepest liquidity and most consistent rates.
Checking Historical Stability
Before backtesting, use the History Explorer to visualize the funding rate history:
- Select your pair (e.g., BTC)
- Choose 90-day timeframe
- Compare rates between your chosen exchanges
Look for consistent spread — the gap between the two lines should stay positive most of the time.
Step 2: Run the Backtest
On FundingView's Backtest page:
- Select the symbol (e.g., BTC)
- Choose Long exchange — the exchange where you'll go long (lower funding rate)
- Choose Short exchange — the exchange where you'll go short (higher funding rate)
- The backtest will simulate P&L over the historical period
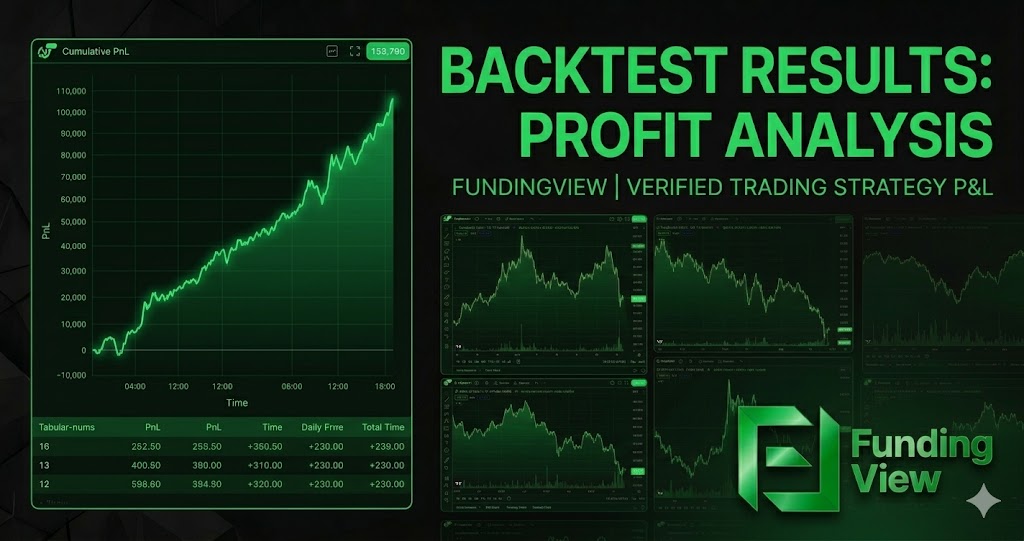
What the Results Show
- Total P&L — How much you would have earned/lost
- APR — Annualized return
- Cumulative chart — Visual P&L over time
- Drawdown — Maximum negative period
Step 3: Interpret the Results
Good Signs
- Steadily rising P&L curve — Consistent earnings over time
- APR > 15% — Sufficient to cover fees and opportunity cost
- Small drawdowns — No extended periods of loss
- Consistent across timeframes — Works on 30d, 90d, and 365d
Red Flags
- Choppy P&L curve — Alternating between profit and loss
- Large drawdown periods — Extended weeks of negative funding
- APR only high in one period — Might be a temporary spike, not a reliable strategy
- Very different results on different timeframes — Sign of instability
Step 4: Avoid Common Backtesting Mistakes
Overfitting
The trap: Finding the one exchange pair that happened to work perfectly in the last 30 days.
The fix: Test across multiple timeframes (30d, 90d, 365d). If the strategy only works on one specific period, it's probably not robust.
Survivorship Bias
The trap: Only backtesting pairs that currently exist. Some pairs may have been delisted.
The fix: Focus on established pairs (BTC, ETH, SOL) that are unlikely to be delisted. Be skeptical of results from very new pairs with limited history.
Ignoring Fees
The trap: Your backtest shows 40% APR, but you forgot about 0.1% entry/exit fees on each exchange.
The fix: Subtract realistic fee estimates from your results. Use Execution Cost data for accurate numbers.
Ignoring Slippage
The trap: Assuming you can enter and exit at the exact price shown.
The fix: Add a slippage buffer (0.05-0.1%) for each trade. Large positions on low-liquidity pairs will have higher slippage.
Step 5: From Backtest to Live Trading
Once your backtest looks solid:
- Start small — Use 10-20% of your intended capital
- Paper trade first — Track positions mentally for a week without real money
- Monitor the first week closely — Compare live results with backtest expectations
- Scale up gradually — Increase capital as confidence grows
Expected Differences Between Backtest and Live
- Slippage: Live trades will have slightly worse execution
- Timing: You can't enter at the exact historical moment
- Rate changes: Future rates may differ from historical patterns
- Fees: Make sure you're using fee discounts in live trading
Advanced: Multi-Pair Portfolio
Once you're comfortable with single-pair backtesting, consider running a portfolio approach:
- Backtest 5-10 different pairs independently
- Allocate capital across the top 3-5 performers
- Rebalance monthly based on updated backtests
This diversification reduces the risk of any single pair's funding rate flipping.
Tools on FundingView
| Tool | Use For |
|---|---|
| Backtest | Simulate P&L with historical data |
| Strategy Finder | Find stable, high-APR pairs |
| History Explorer | Visualize funding rate patterns |
| Dashboard | Monitor live rates after entering positions |
| Execution Cost | Estimate real trading costs |
Start Backtesting Now
Ready to test your strategy? Open the Backtest Tool →
Not sure which pairs to test? Check the Strategy Finder →
Backtesting uses historical data and does not guarantee future results. Always start with small positions when moving from backtest to live trading.